What Is a Chart of Accounts?
Ever feel like your business finances are a jumbled mess of receipts and invoices? If you’ve ever stared at a pile of paperwork and wondered where to even begin, you’re not alone. The solution is something called a Chart of Accounts, or COA for short.
At its core, a Chart of Accounts is the financial filing system for your entire business. It’s a complete list of every single account in your general ledger, neatly organized into categories. This isn’t just about being tidy; it’s about creating a clear, easy-to-read blueprint of your company’s financial health.
Your Business’s Financial Filing Cabinet

Think of the COA as the ultimate digital filing cabinet for your money. Every dollar that flows in or out of your business has a specific folder where it belongs.
When you spend money on a new ad campaign, that transaction goes into the “Marketing & Advertising” account. When a customer pays their invoice, that money is filed under “Sales Revenue.” This simple act of sorting transforms a chaotic jumble of numbers into a coherent story about your business performance.
The Blueprint for Financial Clarity
This organizational system is the absolute bedrock of all your financial reporting. Without a COA, trying to create a Profit and Loss statement or a Balance Sheet would be a nightmare. Your accounting software relies on this structure to automatically pull the right numbers and generate those vital reports for you.
A well-built Chart of Accounts turns confusing data into real-world insights. It shows you exactly where your money comes from and, just as importantly, where it’s all going. This clarity is what empowers you to make smarter, more confident decisions.
Every COA is built around five main account types. Understanding these is key to getting your finances organized.
Here’s a quick breakdown of those core categories:
Quick Look at Chart of Accounts Categories
| Account Type | What It Represents | Example |
|---|---|---|
| Assets | Everything your company owns. | Cash, equipment, inventory, accounts receivable. |
| Liabilities | Everything your company owes. | Loans, credit card debt, accounts payable. |
| Equity | The net worth of your business. | Owner’s investment, retained earnings. |
| Revenue | All the money your business earns. | Sales, service fees, interest income. |
| Expenses | All the money your business spends. | Rent, salaries, marketing, office supplies. |
Getting these five categories right is the first step toward building a COA that truly works for your business.
This entire framework underpins all small business financial reporting, giving you the visibility you need to spot trends, manage your budget, and plan for the future. A solid COA is what separates businesses that are just getting by from those that are set up to truly grow.
The Five Core Building Blocks of Your COA
So, what exactly is a chart of accounts? At its heart, it’s just a way to organize your money. Think of it like the chapters of your business’s financial story, with every single transaction finding its place in one of five key categories.
Getting these categories right is what gives you a clear, honest picture of your company’s health.
The first three categories are what we call Balance Sheet accounts. These give you a snapshot of your business’s net worth on any given day.
This image really helps visualize how they fit together.
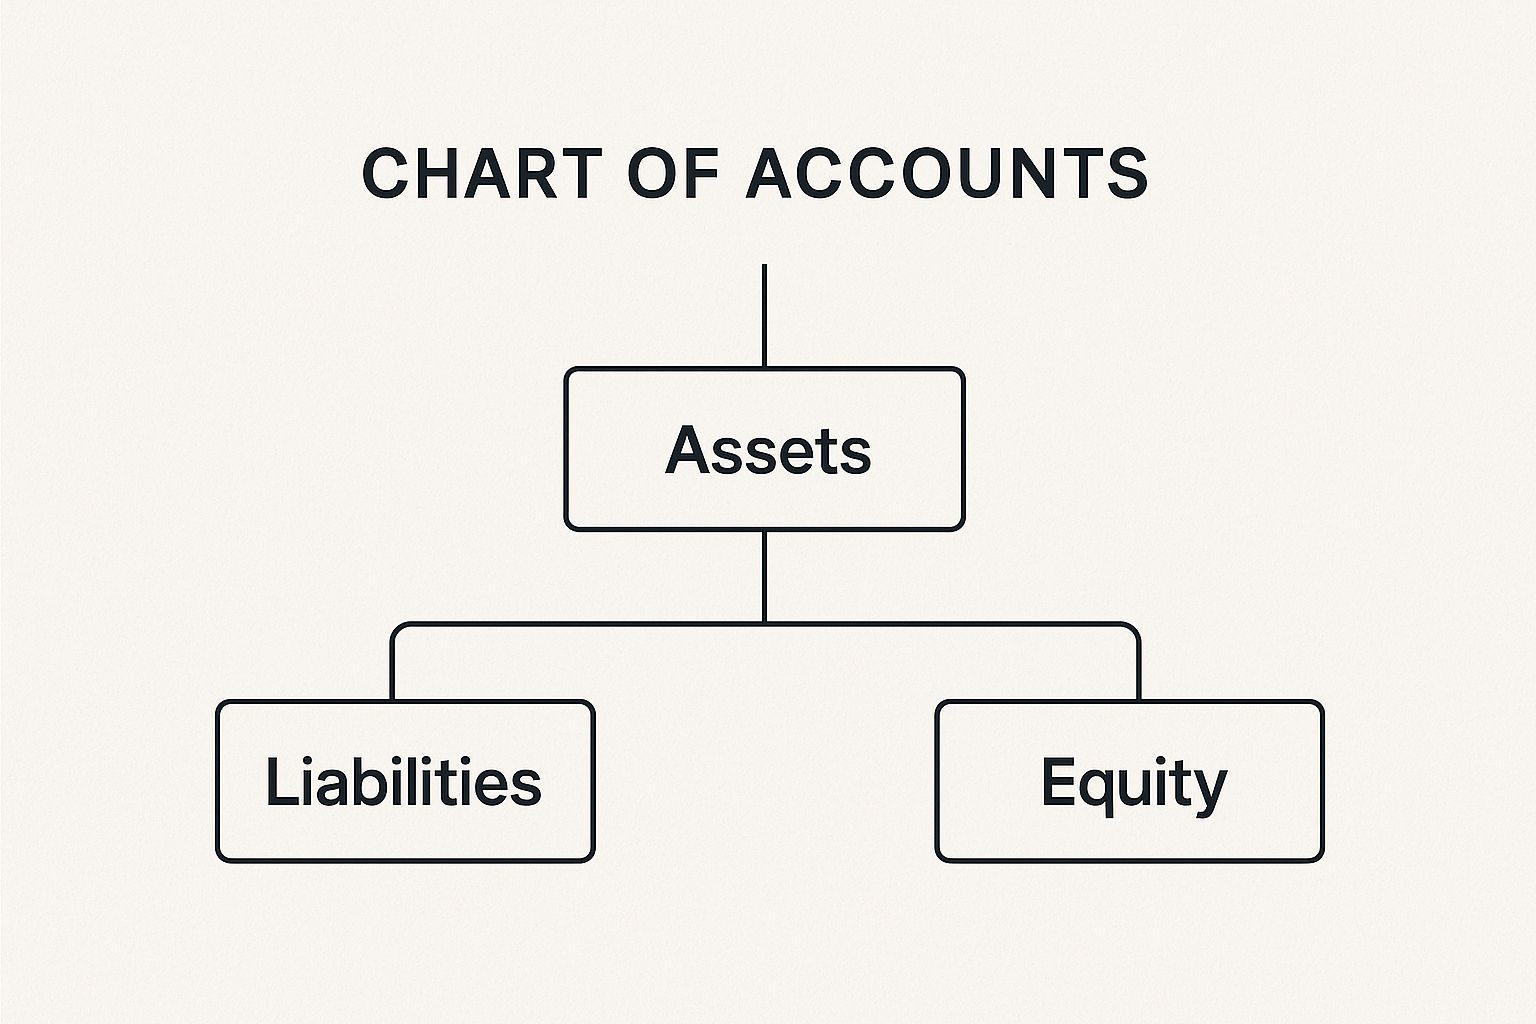
As you can see, your financial foundation is built on what you own, what you owe, and what’s left over. Let’s break that down.
Balance Sheet Accounts
- Assets: This is all the stuff your company owns that has value. We’re talking about the cash in your bank, of course, but also physical things like your work computers and office chairs. It even includes money customers owe you, which we call Accounts Receivable.
- Liabilities: This is everything your company owes. Liabilities are your debts—from a formal business loan to the balance on your company credit card or bills you need to pay your suppliers (Accounts Payable).
- Equity: This is the money left over after you pay off all your debts. The classic formula is Assets – Liabilities = Equity. It represents the owners’ stake in the business, including any money they put in to start it and the profits that have been reinvested over time.
Here’s a simple way to think about it: Assets are what you have, Liabilities are what you owe, and Equity is what you’re truly worth. This little equation is the bedrock of all accounting.
Income Statement Accounts
Next up, we have the Income Statement accounts. These don’t show a snapshot in time; instead, they tell a story over a period—like a month, a quarter, or a year—and reveal whether you actually made a profit.
- Revenue (or Income): This is the money your business earns from its main activities. If you run a coffee shop, it’s the cash from every latte and croissant sold. If you’re a freelance designer, it’s the fees you invoice for your projects.
- Expenses: These are all the costs of doing business. We’re talking about everything from rent and payroll to software subscriptions and your marketing budget. Keeping a close eye on expenses is how you stay in control of your spending and, ultimately, become more profitable.
How Account Numbers Create Order from Chaos
So, what stops a chart of accounts from being just a messy list of financial terms? The secret is in the numbers. Account numbers are what bring logic and order to your financial data, turning your COA into a tool you can actually use every day.
Think of it like the Dewey Decimal System, but for your business finances. This simple numbering system lets you sort, find, and understand your financial information instantly. Each of the five main account types gets its own number range, creating a clear hierarchy that just makes sense.
A Common Numbering System
Most accounting software, like QuickBooks or Xero, uses a pretty standard framework for this. While your specific numbers might be a little different, the underlying logic is almost always the same.
Here’s a typical setup:
- 1000–1999 for Assets (what you own)
- 2000–2999 for Liabilities (what you owe)
- 3000–3999 for Equity (your net worth)
- 4000–4999 for Revenue (what you earn)
- 5000–5999 for Expenses (what you spend)
This structure is what makes pulling reports so easy. For example, when you see a number starting with a “1,” you know you’re looking at an asset. Simple as that.
But the real magic happens when you use sub-accounts. That numbering system leaves plenty of room to get more specific. A general expense account like 5100 Utilities can be broken down into more detail:
- 5110 for Electricity
- 5120 for Water
- 5130 for Internet
This level of detail is a total game-changer. It helps you see exactly where your money is going, run incredibly precise reports, and keep your books tidy and accurate. This is what makes a chart of accounts so powerful in practice.
A well-developed chart of accounts can reduce financial statement errors by up to 25% and significantly improve audit efficiency, turning a complex process into a much simpler task. You can explore more insights on how coding systems improve financial accuracy at CPA Hall Talk.
Real-World Chart of Accounts Examples
Okay, let’s move past the theory. The best way to really get what a chart of accounts does is to see it in action.
Every business has its own unique fingerprint, and your chart of accounts should reflect that. It’s not some generic checklist you download; it’s a living document that’s built around the way your company actually makes and spends money.
To make this crystal clear, let’s look at two totally different small businesses: a freelance writer and an online store selling handmade goods. Seeing them side-by-side really highlights how a chart of accounts is customized to tell the right financial story.
Sample COA: Freelancer vs. Ecommerce Store
The fundamental difference here boils down to one thing: services versus products. The freelancer sells their time and skills, while the ecommerce store sells physical stuff. This single difference dramatically changes what they need to track.
Take a look at how their most important accounts might differ.
| Account Category | Freelancer Example Account | Ecommerce Example Account |
|---|---|---|
| Asset | Accounts Receivable | Inventory |
| Revenue | Writing Services Income | Product Sales |
| Expense | Software Subscriptions | Cost of Goods Sold |
| Expense | Home Office Expenses | Shipping & Fulfillment Costs |
For our freelance writer, the money trail is pretty straightforward. Revenue flows into an account like Writing Services Income. Their key expenses are things like Software Subscriptions for writing tools or Home Office Expenses. They don’t have a warehouse full of products, so an inventory account would be totally useless.
Now, flip over to the ecommerce store. Their whole business lives and dies by their products.
They absolutely need an Inventory account to know the value of all the goods sitting on their shelves. When an item sells, its cost gets recorded in a crucial expense account called Cost of Goods Sold (COGS). This is how they figure out their actual profit on each sale.
They’ll also have unique expenses the freelancer would never see, like Shipping & Fulfillment Costs and Payment Processing Fees from services like Shopify or Stripe.
Ultimately, these examples show you exactly what a chart of accounts is meant to be: a financial mirror reflecting your specific business operations.
Why a Strong COA Is Your Business Superpower

A well-built Chart of Accounts (COA) is so much more than a stuffy list for your bookkeeper. Honestly, it’s one of the most powerful tools in your arsenal. Its real magic lies in turning confusing financial data into a clear roadmap for smart, sustainable growth.
Just think about tax season for a minute. With a solid COA, all your tax-deductible expenses—like “Office Supplies” or “Software Subscriptions”—are already sorted. This takes a massive headache out of tax prep and helps you confidently claim every single deduction you’ve earned.
Making Smarter Money Moves
A good COA is the bedrock of any real financial planning. It gives you the hard data you need to budget accurately and make realistic forecasts. You can see exactly where every dollar comes from and, more importantly, where it’s all going.
This kind of clarity is absolutely critical if you’re ever looking for funding. Banks, lenders, and investors won’t even talk to you without clean, easy-to-understand financials. A detailed COA proves you’re on top of your numbers, which builds the trust you need to secure that capital.
This isn’t just a small business thing, either. The COA is the backbone of financial management at every level, right up to government accounting. It’s how massive organizations maintain transparency and accountability with public money.
The COA isn’t just an accounting chore; it’s the foundation for financial insight that empowers you to steer your business with purpose. It transforms numbers into a narrative you can act on.
This is exactly why modern tools are built around this structure. It’s fascinating to see how leading accounting software like Xero leverages structured financial data for growth, from streamlining payroll to uncovering new opportunities.
Common Questions About the Chart of Accounts
Once you start using a chart of accounts, you’ll inevitably run into some real-world questions. It’s one thing to get the theory, but it’s another thing entirely to manage it day in and day out. Let’s tackle some of the most common questions business owners have.
Getting a handle on these details will give you the confidence to manage your COA and keep your financial records both clean and genuinely useful.
Can I Change My Chart of Accounts Later On?
Yes, absolutely! Your chart of accounts isn’t carved in stone. Think of it as a living document that should grow and adapt right alongside your business. As you expand, you’ll naturally need to add new accounts (like ‘Salaries and Wages’ when you bring on your first employee) or even hide old ones that you no longer use.
A quick heads-up, though: try to avoid massive overhauls in the middle of a financial year. Shuffling everything around can make your year-over-year reports a real headache to compare later on.
The best time for big changes, like re-numbering entire sections, is at the start of a new fiscal year. Adding a new account here or there is fine anytime. Just be sure to chat with your accountant before deleting or merging accounts with a history—you don’t want to mess up your audit trail.
Does My Accounting Software Create a COA for Me?
Pretty much all modern accounting software, like Xero or QuickBooks, will give you a default chart of accounts when you first set things up. It typically asks for your industry and then spits out a template it thinks will work.
This is a great starting point, but it’s almost never a perfect fit straight out of the box. The default list might be too generic for your needs, or it could be bloated with a bunch of accounts you’ll never touch.
The magic is in the customization. You need to roll up your sleeves and fine-tune it. Rename accounts to match the words you actually use, add any that are missing, and deactivate the ones that are just cluttering things up. That personal touch is what transforms your COA from a simple list into a powerful tool for real business insight.
How Detailed Should My Chart of Accounts Be?
Finding the right level of detail is a bit of a balancing act. You want it detailed enough to give you clear answers for making smart decisions, but not so complicated that bookkeeping becomes a nightmare you dread.
A freelance consultant might only need 30-40 accounts to run their business effectively. On the other hand, a small retail shop managing inventory could easily have over a hundred. A good rule of thumb? If you want to track an income or expense source closely, give it its own account.
For example, instead of one vague “Marketing” account, you could break it down into:
- Social Media Ads
- Email Marketing Software
- Content Writer Fees
This way, you can see exactly where your marketing dollars are going and figure out which channels are actually bringing in a return.
What’s the Difference Between a COA and a General Ledger?
This one trips a lot of people up, but the difference is actually pretty simple.
Here’s an easy way to think about it: the Chart of Accounts is the table of contents, and the General Ledger (GL) is the book itself.
The COA is just the organized list of all your financial “folders”—the account names and numbers. The General Ledger, however, is the full story. It’s the complete, line-by-line record of every single transaction that has ever been posted to each of those accounts. So, when you click on your “Office Supplies” account in your software, that long list of every pen, paper ream, and ink cartridge purchase? That’s the General Ledger detail.
Getting your chart of accounts set up and maintained correctly is a cornerstone of a financially healthy business. If you’d like an expert to help make sure your financial systems are built for success, the team at Business Like NZ Ltd is here for you. We specialise in taxation and business advisory for small and medium businesses in Auckland, helping you achieve financial freedom. Contact us today to learn how we can support your business.